|
Message:
Hello,
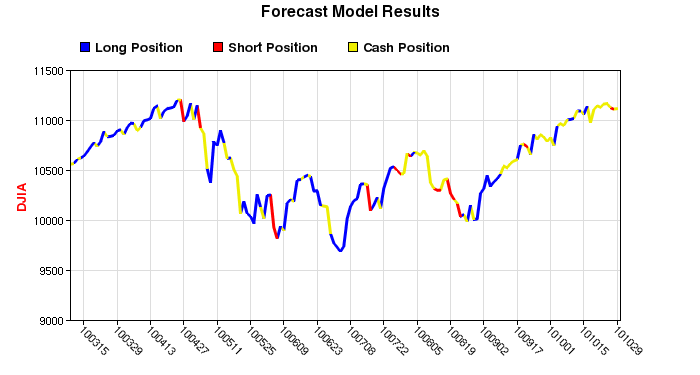
A look back at the last 165 days graph, with coded colors for buy/short/cash
, shows no clear pattern for opportunistic buying or shorting. The market tanked
from 11k to 10k, then bounced back up from 10k to 11k -- with what appears to
be straightforward momentums , but unfortunately the model didn't take advantage
of them. It feels to me a bit of a coincidence that the model is up 5% over 165
days, and buy&hold is also up 5%. But the model could have just as easily been
down 5% based on the graph, which doesnt seem to show a systematic trading pattern..
I feel based on the dip to 10k and rise to 11k, the model should have achieved
at least a 10% return at this point in the year... sorry for giving you a bit
of a hard time, I am only looking at the outcome of the model and do not comprehend
the algorithms behind it, but I do think a discussion about performance is worthwhile
|
|
Response:
Last year was an exceptional year for us with a return of 51 percent but
as you have pointed out, we have been struggling this year. We made several minor
network weighting changes to version 25, a version we had used for almost two
years, but that did not correct the performance problem. On October 2, we
installed a model update (version 26) which looks promising. Unfortunately, since
we do not go back and change past results, the performance data for this version
previous to the update are not shown in the graphs and table on the forecast
page. I can show here, however, what the trading performance would have been
for the last 165 trading days. Below is a graph of version 26 results:
|
